Category: economic development

  • USA, The OverConsumer of Paradise

    Despite comprising just 4.3% of the global population, the U.S.
    accounts for a staggering 32% of worldwide personal consumption. This
    statistic highlights the significant economic weight of American
    consumers, who drive demand both at home and abroad. However, it also
    underscores a profound social responsibility: as a dominant force in
    global consumption, U.S. consumers have the power to influence market
    trends, sustainability practices, and social equity. The choices made by
    American shoppers not only shape the economy but also have far-reaching
    implications for the planet and future generations.

    Source: International Monetary Fund; United Nations as of December 2023.

    Assistance of ChatGPT and Image by DALL-E (2024, Aug) with prompts by E. Hall. 

    #Sustainability #Consumption #EconomicDevelopment #IntellZine #SustainZine 

  • Innovative Countries — Global Innovation Index

    Innovative Countries — Global Innovation Index

    This is a great summary of innovation by country from Visual Capitalist. See the Global Innovation Index (GII) map here:https://www.visualcapitalist.com/most-innovative-countries-2022/

    First Published on IntellZine.com. Note the sustainability implications from innovation, and the lack of innovation.

    We,
    at Strategic Business Planning Company, www.SBP.com, are always
    interesting in all aspects of innovation. Sometimes we hear from a
    layperson or an executive that the most innovative country in the work
    is …  

    Israel and Ireland were
    mentioned in recent years.  One executive said that “all innovation
    comes from Israel”. All right, admittedly, Israel is a great source of
    innovation and invention, but it is a very small country (population,
    GDP). In absolute terms, Israel is not even close, but in relative terms
    (adjusted for size of country), Israel is a very respectable #16 in the
    world (GII score of 50.2).

    So,
    a quick search came up with this great source at Visual Capitalist
    shows that the top 6 countries are: Switzerland, USA, Sweden, and the UK
    all with innovation scores above 60. The rest of the top 10 had
    innovation scores over 56.

    Rank

      Country / Region

    Score

    1

    Switzerland

    64.6

    2

    U.S.

    61.8

    3

    Sweden

    61.6

    4

    United Kingdom

    59.7

    5

    Netherlands

    58.0

    6

    South Korea

    57.8

    7

    Singapore

    57.3

    8

    Germany

    57.2

    9

    Finland

    56.9

    10

    Denmark

    55.9

    Here is the summary of how the Global Innovation Index is developed/designed. (quote)

    Innovation is inherently challenging
    to quantify, but the Global Innovation Index is a longstanding attempt to do
    just that. The framework used for the index was
    designed to create a more complete analysis, comprising of 81 indicators
    across seven categories to calculate a country’s score:

    7 Categories

    Example Indicators

    🧳 Business Sophistication

    Business R&D spend, net inflows of foreign direct
    investment

    📈 Market Sophistication

    Size of economy’s GDP, intensity of local market
    competition

    🛣️ Infrastructure

    Road, hospital, school construction, energy efficiency

    👩‍🏫 Human Capital & Research

    Government funding per pupil, quality of scientific and
    research institutions

    🏛️ Institutions

    Political stability and safety, ease of starting a
    business

    💡 Creative Outputs

    Most valuable brands, industrial design applications,
    trademark applications

    👨‍💻 Knowledge and Technology Outputs

    Patent applications,
    increase in labor productivity, spending on software

    As the above table shows, the
    framework aims to identify indicators that foster an innovative environment and
    breakthrough technologies.

    Other Countries

     The article talks about regions, like North America (namely, US and Canada) and the EU with some 15 very innovative countries. 

    China came in 11th
    (GII score of 55.3). China sucks up technology from around the world —
    legally, unethically, and illegally. And then China shamelessly deploys
    and commercializes technology. In terms of patents, China is by far the
    busiest patent office in the world. World Intellectual Property Organization shows
    that China continues to be the busiest patent office in the world. The
    patent protection in china is not because it is the 2nd largest economy
    in the world behind the USA, it is because patent protection in the
    other big economies is also protected by reducing the knock-offs and
    piracy from China (India and other countries).

    South Africa is generally low on the GII innovation index with South Africa rated 61st country (GII of 29), then Morocco and Tunisia. The nexus of innovation (regions or pockets of innovation) seems to explain much of the GII innovation.

    Summary

    Innovation is complex with may areas that enable economic growth and development. A well rounded environment for invention and innovation is best. There are several ways to get to an economic environment that is innovation enabled and invention friendly.

  • Misery Index (and Pain Index)

    The Misery Index hasn’t been talked about much since the
    1970s when unemployment was really high and inflation was double digit. The
    argument is that high unemployment is painful, and high inflation is painful,
    so when you add the two together you get a good measure of the misery throughout
    the economy. Both presidents Ford and Carter had average Misery indexes of 16,
    but Carter when out of office in 1980 leaving a Misery Index of almost 20 to
    Ronald Reagan.

    Pain Index

    Wikipedia does a great job of organizing information and
    trends related to Misery Index
    by country over time. The article presents 2013 as an example year, just a
    couple years out of the worldwide Great Recession of 2007-2008. Several
    countries had Misery Indexes of 60 or more (Venezuela, 79.4 and Iran, 61.6).  The US had a Misery Index of 11 in 2013,
    predominantly because of persistently higher unemployment, inflation was below
    2%.) High inflation, or even hyperinflation, is usually associated with an
    unstable economy.  In 2019, Venezuela had
    a Miser Index that was basically unmeasurable because of inflation that was
    1000% or far higher.

    In the 1980s, many Latin American countries had business
    relations and huge debts that amplified the misery from the US, especially
    loans that were payable in US Dollars. Many countries had misery indexes that
    were twice that of the USA. Ouch!

    Full Employment

    Full employment was considered by economists at about 6% unemployment.
    Six percent seemed like a good level of unemployed to allow for people moving
    from location to location, job to job, entering and leaving the workforce. So,
    the base misery index would be about 6 at full employment and 0% inflation. But
    as we got into the 21st century, especially about 6 years after the
    Great Recession, it became clear that full employment could be less than 6%,
    Maybe 5%? At end of Obama era and into Trump years, unemployment moved down to
    about 4%. With extremely low inflation, the Misery index dropped to a total of
    about 5 or 6 in the US.

    Modified Misery Index (MI+)

    Some economists like to modify the misery index to reduce
    the index by the amount of GDP growth.

    Misery Index = Unemployment + Inflation (or MI = U + I)

    Misery+ = Unemployment + Inflation – GDP Growth (MI+ = U + I
    GDP
    )

    The pain of unemployment is obvious for the unemployed. For
    the economy, a year in which a person is unemployed also a year lost worth of
    GDP contribution from that person; let’s say a loss of GDP of twice (2x) that
    person’s salary.

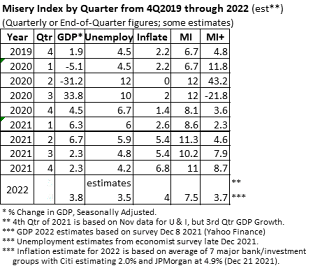
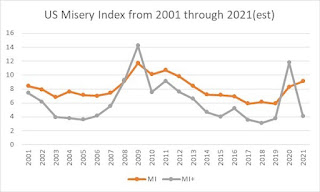
    US Misery Index (MI+) 2001 thru 2021

    The pain of inflation is not so obvious. If inflation is 5%
    and wages increase by 5%, then the average employee is equally well off.
    Central bankers tend to aim for 1%, but less than 2% inflation. Higher inflation
    can destabilize the economy (more) because it increases uncertainty and reduces
    the ability of businesses, governments, and individuals to plan (and invest).

    If the economy is growing, let’s say because of productivity
    growth, then that can offset the level of pain and misery. Productivity growth
    can be roughly represented in GDP growth. 

    Coming out of the Great Recession of 2008, unemployment had
    risen to about 18%, inflation was consistently low, close to zero; and GDP
    growth was chugging along at 2% to 3%.  The
    Misery Index was about 20. MI+ was about 17 (when reduced by 2%-3% GDP growth)
    which looks better but is still painful. No one wanted to give up a job if they
    had one; and getting a job if you had none, was ugly. This was misery and pain,
    and the US was in much better positions than many countries (even though the
    Great Recession was totally manufactured in the US housing asset bubble).
    Countries that relied on tourism were hammered by the lack of visitors. No
    business travel. The normal vacationers were hit by a triple whammy: no job, or
    job uncertainty; the crash of savings and retirement funds; and the collapse of
    the housing market where people were struggling to keep their homes or had
    already lost them. Ouch! That was painful.

    Recessions: Destructive Innovation

    Recessions are good, and bad.

    An old economics joke (if there are really any economic
    jokes, maybe pun is better) is: What is the difference between a recession and a
    depression? A recession is when your neighbor loses his job; a depression
    is when you lose your job.

    Recessions are destructive innovation. They accelerate the
    retirement of old business models toward new and better. The Great Recession of
    2008 and the Pandemic Recession of 2020, both accelerated transitions away from
    big malls. The Recession 2020 massively accelerated online shopping and the
    ability of employees to work from anywhere (telework). Surprisingly, most
    businesses and schools didn’t really have the full ability to work online
    (security, bandwidth, collaboration); now they can. Big campuses and office
    buildings may never go back to full capacity.

    On the macro level, the economy in 2019 was zipping along at
    approximately full employment (4.5%) and a GDP of about $21.5T. During the big
    pandemic shutdown in 2Q2020, the economy shrunk about 30%. That’s a lot like
    turning off all the (economic) engines and diming all the lights with the hopes
    that all the moving parts of the economy would be operational and in place when
    the power comes back on. It seems that pandemic relief and the resilience of
    the businesses/people allowed for a jump start back out of the recession.
    Economic growth in 3Q2020 was +33%. By the end of 2021, the economy is/was
    zipping along at about $23T annual GDP. Wow.

    But the economy is different in small and big ways. The
    pre-pandemic economy was 70% services (69%, actually). Now people are buying
    more goods and only 65.5% services. Both the goods, and the services are
    different now. Very little international travel, so countries relying on
    international leisure and business travelers are getting hammered. More to fix
    up your house. Try buying a boat, an RV, an ATV, an auto, or a house!  People are buying differently; think Amazon,
    eBay, Etsy. 

    The toilet paper problem during the pandemic was that there
    were two supply chains for toilet paper: the soft and cushy 2-ply for
    households, and coarse (Brillo pad) single-ply for businesses and government.
    Turns out they were totally different supply chains.

    Changes in supply chains, increased demand along many supply
    chains and supply interruptions (labor, containers, etc.) all resulted in
    shortages and cost increases. The biggest factor in 2021 inflation is energy,
    which filters through all aspects of the economy into the food chain and supply
    chains.

    Oil demand went back above 100 million barrels per day, in
    an industry (fossil fuels) that needs to be discontinued sooner, not later, to
    meet climate goals. The transition away from fossil fuels, will be disruptive. Why
    invest more in rigs, pipelines, and tankers if the entire industry needs to be
    phased down in 10 years and phased out in 30 years?

    BIG oil (Saudi, Russia, Exxon, etc.) is hoping we will never
    make the switch off our oil-addiction… After 40 years of talking about it, they
    seem to be largely correct. 

    Healthy Consumers

    During the Pandemic Recession, many people saved lots of
    money. First, there was no good place to spend money, except maybe to fix up
    your house. The Federal Government shoveled out buckets of money to families.
    And, for those people who kept their jobs, most of them had suddenly reduced
    their monthly expenses in traveling to work and eating out.  Staycations, not vacations. Personal and
    Institutional savings went from just over $1T in 2019 to $4T 1Q2021 (BEA.gov).

    Housing values have jumped by 30%, 40% or even 50% in many
    locations, leaving those people lucky enough to own housing real estate in a
    very sweet position. Selling may be the easiest it has been in decades. Low
    interest rates and very few properties for sell. Since the Great Recession we have
    built far too few houses, so there really is a bit of a housing shortage; no
    bubble in sight. Of course, people looking to buy, or rent, are not going to be
    happy.

    The stock market, and retirement funds, have gone only up
    since the great recession. There was a retraction for the pandemic, but
    otherwise it has continued to go higher. In 2021, all the US markets were up
    dramatically with the S&P 500 up 25+%, hitting 70 all-time highs throughout
    the year. Many market analysists think a small correction, or even a big
    correction, is near; but the bulls seem to be winning almost every week.

    So, let’s see if we have this right? Unemployment is the
    lowest it has been in our lifetime. Employment opportunities are the best they
    have every been with job openings exceeding the applicants by 2 or 3 times. If
    people want to go back into the workforce they can, but they can probably
    afford not to work for the indefinite future. The house is probably worth
    several times what you paid for it. Investments are good and retirement fund is
    bulging at the seams. Your old car is worth more than you paid for it 5 years
    ago.

    Inflation is up, especially for housing, fuel, and food;
    but, if your salary is up as well, that shouldn’t be too bad. The cost-of-living
    increase is 5.9% for retirees who probably own their house and don’t drive
    much.

    Your biggest problem is you must wait 6 months for your new
    car; and you may have to postpone, again, your international vacation. Consumers
    may be in better positions than they have been in years.

    Why do many people think the economy is in the toilet and
    why are so many people so anxious?

    Anxiety and Fear

    The consumer is probably better, financially, then he or she has been for a couple decades. But COVID uncertainty and political divisiveness has wreaked havoc. And then there is the new, wildly prolific, Omicron strain of COVID-19. Normally during times of war or major uncertainty, the US has pulled together. Not this time. That doesn’t seem to be happening. 

    Somehow, we seem to have dropped into the abyss that news outlets have fallen into. Good news, and even great stats, are a yawn. Bad news, with death and mayhem, that’s news! So, news outlets have moved to sensationalizing. And talking heads perpetually pander to their base. It is hard to find fair and unbiased sources, and most people have gotten to where they don’t want or believe real news. 

    Fear mongering seems to work, at least to build followers. 

    And everyone is always stressed out. Even if things are really quite good, all things considered. Especially when considering that we’ve had two-year of pandemic, and more than 800,000 US deaths associated with COVID. We’ve had a world economy come to a complete stop and now we are some 5% further than before. That is pretty spectacular. 

    Look at how far we have come up the mountain range, not at the last high peak. Imagine how easy things might be if we all worked together? 

    #Innovation #DestructiveInnovation #MiseryIndex #Inflation
    #Unemployment #EconomicDevelopment


  • OZ, by any other Name, could be a Profitable Opportunity!

    OZ, by any other Name, could be a Profitable Opportunity!

    Qualified Opportunity Zone Map for USA

    Opportunity Zones present a hidden opportunity for Real Estate (RE) investment that should be widely utilized across the US. Why not? (View Interactive HUD Map here.)

    There’s a spectacular investment tool that was associated
    with tax cuts of 2017 by the Trump administration. Along with the massive tax
    cuts, there was a non-partisan tax break to funnel private investments into
    underdeveloped communities around the nation.

    It took a couple years for the census tracts in every state
    to be identified and for the final definition of the program. There are 8,700+
    census tracts across the US that are designated as “zones”. Most people are
    surprised to find that they live in, or within a few miles, of one of these
    special tax – legal loophole – areas. There are at least two major reasons why
    these special zones have not received substantial attention and engagement: massive
    confusion related to the name, Qualified “Opportunity Zone” (QOZ); and, the
    COVID pandemic/recession.

    OZ, We’re not in Kansas Anymore, Toto.

    Using the term “Opportunity Zone” for these census tracts
    across the nation, was a horrible idea. People think of Enterprise Zones (EZs),
    Industrial Parks, Community Redevelopment Areas (CRAs) and such when they hear
    “Opportunity Zone”. Enterprise Zones are usually a specific campus or
    industrial park, so a business has to locate, or relocate there. Plus, an EZ
    usually has specific target business development such as light-industrial, or
    high-tech research. Business incubators often are located inside an EZ.  Foreign Trade Zones (FTZs) might be added to
    EZs where there is a port (or airport) of entry to enjoy special import/export
    treatment. Anyone, and everyone, who hear about Qualified Opportunity Zones for
    the first time have to disconnect their thinking from the historic use of
    “Opportunity Zones”. Essentially, we’re not in the land of OZ anymore, we’re in
    a qualified version of OZ, a Q.O.Z. Maybe a better approach would be to
    redefine a term or acronym for QOZ. It is a legal tax loophole related to
    designated census tracts; maybe calling it something a Qualified Opportunity
    Tax Area would be better. Let’s use QOZ for the qualified tax areas; and
    QOZ-Fund for the formal bank account of the qualified company that manages
    QOZ funding and reports to the IRS; and QOZ-Property for the real estate
    investments that are central to the QOZ project.

    Probably and equal put-off is that an investment in a QOZ
    goes into a “Fund”. This sounds complicated, a lot like setting up and managing
    your own mutual fund; however, it is surprisingly straight-forward.  Essentially, set up a bank account specific
    to the real estate investment within a qualified census tract; let the IRS know
    on a form (Form 8997) that money has come in from capital gains of an investor;
    and later let the IRS know that the property has been sold and that taxes are
    now payable. (Taxpayers file a Form 8949 each year illustrating how much
    capital gains tax continues to be deffered.) The investors’ capital gains taxes
    could, and should, be much lower in addition to being deferred.  The funding associated with such an investment
    is called an Opportunity Zone Fund (QOZ-Fund).

    The Opportunity
    Zone program creates a tax incentive for individuals who reinvest unrealized
    capital gains into high-impact, long-term projects in high-poverty communities
    across the country. It is based upon bipartisan legislation authored by U.S.
    Senators Cory Booker (D-NJ) and Tim Scott (R-SC). (Booker press release, Oct
    31, 2019)

    The Opportunity
    Zones provision is based on the bipartisan Investing in Opportunity Act, which
    was championed by Senators Tim Scott (R-SC) and Cory Booker (D-NJ) and
    Representatives Pat Tiberi (R-OH) and Ron Kind (D-WI), who led a regionally and
    politically diverse coalition of nearly 100 congressional cosponsors. (Economic
    Innovation Group, https://eig.org/opportunityzones/history)

    Who should consider QOZ projects?

    Answer 1: Anyone involved in real estate in or adjacent to a
    designated QOZ census tract. This, of course, includes Realtors® and mortgage
    lenders, builders, and contractors. (Illegal businesses, and “sin” businesses
    like cassinos, do not qualify.) There are the parties that are exchanging property
    in a real estate sale, of course. The seller would likely have capital gains
    from the sell of the property that could/should be invested somewhere; and a QOZ
    fund investment would allow for deferring or completely avoiding taxes on the
    capital gains. The buyer(s) might want to purchase using their own capital
    gains (from any source). Even outside parties might want to jump in and invest
    in a real estate (or development) project so that they can avoid and defer
    paying capital gains taxes.

    Answer 2: Anyone with capital gains should be interested. This
    introduction of outside parties to a real estate project within a QOZ is
    probably the biggest paradigm shift for many people. Everyone is comfortable
    with bank (debt) financing but using outside (equity) investors may be novel
    for many real estate developers. There is no reason to avoid debt (bank)
    leverage, but the change in ownership will restructure the funding from all
    sources.

    Investors: Capital Gains and Benefits of Taxes Avoided/Delayed

    The beauty of compounding is an almost magical thing. A 7%
    return on investment would double in value about every 10 years. So, a $100,000
    investment might easily grow to a $200,000. That is a reasonable investment
    growth rate for the value of real estate, even if there were no improvements or
    operating profits (like from apartments or offices). But the investment in a QOZ
    Fund would be from moneys that would otherwise be subject to capital gains taxes.
    For most investors this would be 20% or higher tax rates. So instead of
    investing the $100,000, taxes would go to the IRS leaving only about 80,000 to
    invest today. Stated differently, to make the $100,000 investment today, you
    would need $125,000 of money that was taxed at 20% capital gains. (Capital
    gains can be much higher, especially for short-term capital gains.)

    QOZs are a longer-term investment tax mechanism. If you keep
    the investment for 10 years, you pay no taxes (0% tax rate) on the “profits”
    when you sell and cash out of the investment. Wow!… And the taxable amount of
    your original investment will be reduced by approximately 10% if you keep the
    money invested for 5 years (or more). There is a deadline of December 31, 2026
    to reach the 5 year deadline; this deadline puts some pressure to complete a QOZ
    investment into a fund by the end of 2021. After 2021, the 5-year stepdown of
    10% will no longer be possible, but taxes on the original investment will still
    be deferrable until the end of 2026. (There was an additional tax break at 7
    years, but that stepdown of taxes is no longer possible because of the 2026
    deadline.)

    Eventually, you have to pay capital gains on at least part
    of the original investment, but the time that taxes are deferred is time in
    which the compounding of the investment works in your favor. This is a little
    like a traditional IRA, you invest tax-free money today, but pay taxes in 30
    years when you start to withdraw; but during that 30-year period your money
    plus the money that would have gone to the IRS for taxes has been working for
    you. Hopefully, doubling, and then doubling again.

    Map of QOZ Investment Tracts

    How do you know which areas are designated for this special
    OZ tax treatment. The Housing and Urban Development (HUD) has an interactive
    map that allows you to zoom in on a region to find the census tracts that are
    given this special investment status. See the US Map of QOZ census tracts at
    HUD: https://opportunityzones.hud.gov/resources/map

    Some listing services show properties that are in QOZs. So,
    your favorite Realtor would be able to tell you when properties you look at are
    within QOZ tax havens. QOZ status should help to bolster property values.
    Alaska has massive QOZ tracts, and all of Puerto Rico is a QOZ.

    There are several groups who gather QOZ investment
    opportunities around the nation and investors with capital gains to invest. One
    group, OpportunityDB.org, does podcast
    and provides a catalog of various QOZ projects. Many Banks and investment
    houses will assist in creating a QOZ or with finding Funds to consider for
    investing your capital gains.

    Capital Gains in the Future

    The future is uncertain. Many people find themselves locked
    into assets (stocks, real estate, etc.) because selling them would incur a huge
    tax on capital gains. Stocks that you bought in a brokerage account at $10 per
    share are now at 10 times that. Virtually all capital gains! The QOZ program is
    a mechanism to jump out of investments that are in a Capital Gains Trap.

    If you bought property for $1,000 and now it will sell for
    $50,000? Well, there is a mechanism for “like” real estate investments where
    you can move your investment (and profits) from one property to another. But
    there are lots of restrictions to this 1031 tax deferment. Plus, you now have
    your principle and profits tied up in the new real estate.

    But, if you cash out your profits this year, and know that
    you will have to pay capital gains – at least in part – in 5 years, then you
    might be worried about the capital gains rate going up under a Democrat/Biden
    Federal Government. (Capital gains would be the most likely, if any, of the
    possible tax hikes within the next 10 years.) But with an QOZ, you are taking
    out capital gains now, with the expectation of reducing tax payments in the
    future and avoid all taxes on the profits this investment generates. If you
    keep your current capital gains locked up, the lock would be even worse if/when
    capital gains rates go up in the future. Essentially, the Capital Gains Trap gets
    even bigger.

    On the tax side, if you invest in a QOZ in 2021, you should
    start to manage your cash flows for paying some taxes on your capital gains in
    5 years. Your tax forms show (much like your IRAs) how much money you have in
    tax-deferred status. Paying taxes in 5 years, is usually better than paying
    taxes today.

    Profits are a Wonderful Thing

    You should rejoice in making profits. All things equal, you
    should prefer to pay higher taxes because that means that you are making a lot
    of income (profits). In general, you should make your finance and investment
    decisions without considering taxes, and then factor in the tax implications. A
    good investment will rarely be negated by the tax adjustments; but a marginal
    investment might be swayed by tax considerations. Evaluate carefully where you
    invest to make sure the QOZ investment is a profitable venture prior to any tax
    benefits.

    You should never make financial decisions solely based on
    taxes.  Many people have much of their
    life’s savings tied up in a couple asset (classes) that are heavily subject to
    capital gains taxes. The QOZ investment mechanism is a great way to work on
    cashing out of some of the “capital-gains locked assets”.

    It is surprising how little the QOZ tax deferral program
    seems to have been utilized. Makes you wonder why?

    The IRS
    provides questions, answers
    , and a lot of confusion on the topic. Be sure
    to seek advice from professionals who have QOZ knowledge and experience (CPA, RE
    Attorney, Financial Planner, etc.) before making the leap into – and out of –
    QOZ investments.  Of course, if you are
    single, you can try to marry someone who has lost lots of money; then your
    profits might wash with their losses. What could go wrong with that strategy?

    QOZ tracts for Florida and Pennsylvania.

  • World Water Day 2021 Quiz

    World
    Water Day 2021 (March 22) Quiz    
    Name/Team: ____________ 

    (See SustainZine blog post related to this quiz and World Water Day.)
    1.      Approximately
    what percentage of the adult human body is water (H2O)?

    a.       10-15%
    b.      20-30%
    c.       40-50%
    d.      55-65%

    2.      All
    of the following are primary water-related causes of death world-wide except:

    a.       Diarrhea
    b.      Malaria
    c.       Dehydration

    d.      Driving
    into bodies of water while texting

    3.      A
    gallon of DeLand city tap water costs about how many cents (vs. bottled water)?

    a.       <0.6
    cents
    b.      2
    cents
    c.       4
    cents
    d.    8
    cents


    4.      What
    percentage of the world’s water is fresh surface water (lakes, rivers, swamp,
    etc.)?

    a)     
    10.9% of the world’s water
    is fresh and surface water.
    b)     
    5.2%
    c)     
    2.5%
    d)     
    <0.1%

    5.      Of
    the ~7.8B billion world population what number (percentage) do not have safe
    drinking water; what percentage do not have clean septic/sewer?

    a)     
    0.5 Billion (~7%) without
    clean water; 1B without basic sewer/septic (~13%)

    b)     
    1 Billion (~13%) without
    clean water; 1B without basic sewer/septic (~13%)

    c)     
    780 Million (~10%)
    without clean water; 1B without basic sewer/septic (~13%)

    d)     
    780 Million (~10%)
    without clean water; 2B without sewer/septic (~25%)

    6.      About, what
    percentage of the US lakes, rivers and streams are polluted (according to US
    EPA)?  (Polluted, as in no swimming and
    you should not eat the fish, if there are any.)

    a.       5%

    b.      10%

    c.       30%

    d.      50%


    7.      How
    many gallons of water does it take to power a single light bulb for a year
    using NatGas, Coal and Nuclear (100-Watt, incandescent, 12 hours per day)?

    a.       50
    to 60 Gallons
    b.      200
    to 500 Gals.
    c.       1,000
    to 2,000 Gals.
    d.      4,000
    to 8,000 Gals.


    8.      How
    many gallons of water does it take to produce the corn necessary to produce 1
    gal of ethanol?

    a.      
    1-5 Gallons of water went
    into the corn to make up 1 gal of ethanol.

    b.     
    10-15 Gals
    c.      
    20-25 Gals
    d.      30-35
    Gals

    9.      How
    many gallons of water does it take to produce a gallon of ethanol from corn?
    (Not counting the virtual water in the corn from the prior question.)

    a.       None
    b.      0.5
    Gal

    c.       2
    Gals

    d.      3.5
    Gal


    10.  About
    how many gallons of water does it take to extract a gallon of oil?
    (Fracking drilling.)

    a.       No
    water used.

    b.      2-4
    gal of water per 42 Gal barrel of oil

    c.       5-10
    gal of water per 42 Gal barrel of oil

    d.      21
    gal of water per 42 Gal barrel of oil

    11.  About
    how many gallons of water does it take to refine a gallon of gasoline
    from crude oil? (not counting the prior question related to drilling the oil.)

    a.       No
    water used in the refining process.

    b.      0.1
    gal of water used per 1 gal of gasoline produced from crude oil.

    c.       0.3
    gal of water used per 1 gal of gasoline produced from crude oil.
     
    d.       0.7
    gal of water used per 1 gal of gasoline produced from crude oil.

    12.  All
    things considered, how much total water does it take for a single chicken egg?
    (Virtual Water.)

    a.       12 gals

    b.      22 gals

    c.       32 gals

    d.      52 gals

    13.  All
    things considered, how much total water does it take for a pound of beef?
    (Virtual Water.)

    a.       200
    gals

    b.      500
    gals

    c.       900
    gals

    d.      1,800
    gals

    14.  All
    things considered, about how much total water does it take to make a pair of
    cotton jeans, both the cotton, milling, dying and the fabrication? (Virtual
    Water.)

    a.       50
    gallons

    b.      500
    gals

    c.       1,000
    gals

    d.      2,000
    gals

    15.  The
    average American family uses how much water per day at home directly
    (meter and/or well)? (Average household is 2.5 people.)

    a)   60 gals directly per day
    b)     
    95 gals directly per day
    c)     
    125 gals directly per day
    d)     
    300 gals directly per day