Category: national parks

  • Oil & Gas Spills in North America Since 2010

    Oil & Gas Spills in North America Since 2010

    A
    question I sometimes ask of people who think that fossil fuels are here
    forever more and that electrification of everything will never
    happen… 

    Has there ever been an oil spill in Yellowstone National Park? If so, how many?

    The answer I get surprisingly often is “none”. It is, after all, a National Park, right? 

    ArcGIS
    does a map overlay with the data of your choice. In this case the data
    is documented oil and gas spills since 2010, by type of spill and the
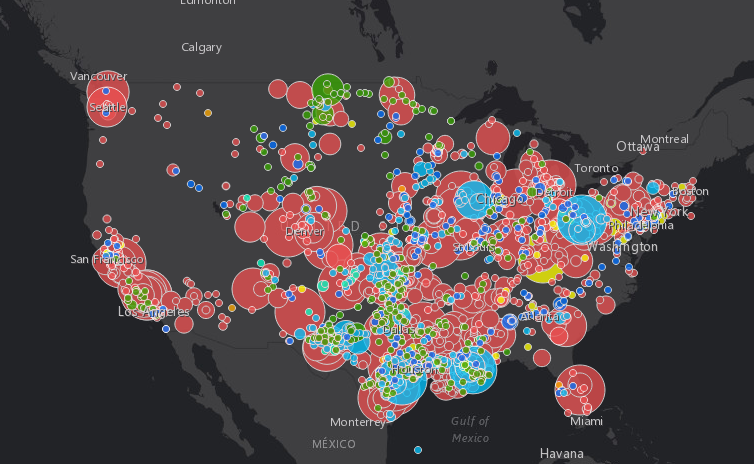
    SIZE of spill. Map for North America here.
    The size of the circle indicates the size of the spill. Note the big
    circles; size of the circle indicates the size of the spill. Blue is
    refined oil (gasoline, diesel, etc.). Red is NatGas. Since NatGas just
    vents into the atmosphere (unless it catches fire or is flared), it’s a
    “clean” spill. Kinda. Natural Gas is a wicked greenhouse gas, with a
    warming factor of 80x more than carbon dioxide. 

    The next chart just shows oil & gasoline spills. Crude oil in green (ironically), refined petroleum in blue. Zoom in and select a circle to find out more about the spill (year and amount).

    Yellowstone is in the northeast corner of Wyoming. Yellowstone has had two notable oil spills
    since 2010: an oil spill on the Exxon-Mobil pipeline in 2011, and
    another spill in 2015 from the pipeline owned by the True Companies.
    Those spills seem tiny compared to the thousands of spills throughout
    North America. No info from Canada though. There have been many oil
    spills in the Alaska pipelines that run all the way through Canada to
    the US.

    Note that there are tens of thousands of old wells that
    have been abandoned; many have never been capped or have been poorly
    capped. Old wells are leaking massive amounts of oil and natgas. The big
    oil companies sell off the depleted wells to small companies. Those
    companies milk the well for a while and then go out of business. 

    “According to the Government Accountability Office, the 2.1 million unplugged abandoned wells in the United States could cost as much as $300 billion.[2]from this Wikipedia article on Abandoned Wells in the United States.
    There are abandoned oil wells everywhere: in the gulf, in Pennsylvania,
    in Texas, in California.  And that is in the USA where there are better
    regulations than most countries. Read about the Biden effort to go out
    and cap them at the NRDC. There are lots of other sources, but you get the idea.

    When
    you think of the costs to the environment, the costs to clean up, and
    the costs to not cleanup, the costs are massively greater than what you
    pay at the gas meter or at the pump. And yet the world’s governments
    still subsidize fossil fuels at the rate of $1T per year. According to the IMF, explicit fossil fuel subsidies are about 1% of GDP, but implicit is 6% to 7% of GDP (about $6T USD).
  • Oil & Gas Spills in North America Since 2010

    Oil & Gas Spills in North America Since 2010

    This was posted over in SustainZine originally, but it does pertain to Innovation. The costs of the old systems of fossil fuels are far greater than the price we all pay at the pump. Plus they are crazy subsidized (one estimate is 1% of GDP directly and about 6% indirectly).

    But here’s the article. *** SustainZine ***

    A question I sometimes ask of people who think that fossil fuels are here forever more and that electrification of everything will never happen… 

    Has there ever been an oil spill in Yellowstone National Park? If so, how many?

    The answer I get is surprisingly often, none. It is, after all, a National Park, right?

    ArcGIS does a map overlay with the data of your choice. In this case the data is documented oil and gas spills since 2010, by type of spill and the SIZE of spill. Map for North America here. The size of the circle indicates the size of the spill. Note the big circles; size of the circle indicates the size of the spill. Blue is refined oil (gasoline, diesel, etc.). Red is NatGas. Since NatGas just vents into the atmosphere (unless it catches fire or is flared), it’s a “clean” spill. Kinda. Natural Gas is a wicked greenhouse gas, with a warming factor of 80x more than carbon dioxide. 

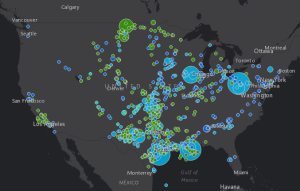
    The next chart just shows oil & gasoline spills. Crude oil in green (ironically), refined petroleum in blue.

    Yellowstone is in the northeast corner of Wyoming. Yellowstone has had two notable oil spills since 2010: an oil spill on the Exxon-Mobil pipeline in 2011, and another spill in 2015 from the pipeline owned by the True Companies. Those spills seem tiny compared to the thousands of spills throughout North America. No info from Canada though. There have been many oil spills in the Alaska pipelines that run all the way through Canada to the US.

    Note that there are tens of thousands of old wells that have been abandoned; many have never been capped or have been poorly capped. Old wells are leaking massive amounts of oil and natgas. The big oil companies sell off the depleted wells to small companies. Those companies milk the well for a while and then go out of business. 

    “According to the Government Accountability Office, the 2.1 million unplugged abandoned wells in the United States could cost as much as $300 billion.[2]from this Wikipedia article on Abandoned Wells in the United States. There are abandoned oil wells everywhere: in the gulf, in Pennsylvania, in Texas, in California.  And that is in the USA where there are better regulations than most countries. Read about the Biden effort to go out and cap them at the NRDC. There are lots of other sources, but you get the idea.

    When you think of the costs to the environment, the costs to clean up, and the costs to not cleanup, the costs are massively greater than what you pay at the gas meter or at the pump. And yet the world’s governments still subsidize fossil fuels at the rate of $1T per year. According to the IMF, explicit fossil fuel subsidies are about 1% of GDP, but implicit is 6% to 7% of GDP (about $6T USD).
  • How Wolves change Rivers.

    When They Brought These Wolves Into The Park, They Had No Idea This Would Happen

     YouTube Video.

    When the government reintroduced Wolves back into the Yellow Stone area (National Park) they had no idea how it would work.

    This is one of the most enlightening videos you will ever see related to biodiversity and good/natural/sustainable ecosystems. In this case, this is recreating a more sustainable ecosystem from the past…

    … But we as a people have devoted our existence, to date, of changing the ecosystems were we live and operate. The costs of doing so, are great!:-(


  • el capitan, my capitan. Yosemite hits 123rd birthday.

    So it seems that Yosemite National Park is 123 years old today. Today, Google pays trubute www.Google.com.  Links to Yosemite search.

    The massive rim fire has brought the Yosemite and Sequoya Parks back into full view. Even if you have only seen them once in your lifetime, it is one of the great spiritual experiences.

    El Capitan, my capitan.