Category: oil spill

  • Oil & Gas Spills in North America Since 2010

    Oil & Gas Spills in North America Since 2010

    A
    question I sometimes ask of people who think that fossil fuels are here
    forever more and that electrification of everything will never
    happen… 

    Has there ever been an oil spill in Yellowstone National Park? If so, how many?

    The answer I get surprisingly often is “none”. It is, after all, a National Park, right? 

    ArcGIS
    does a map overlay with the data of your choice. In this case the data
    is documented oil and gas spills since 2010, by type of spill and the
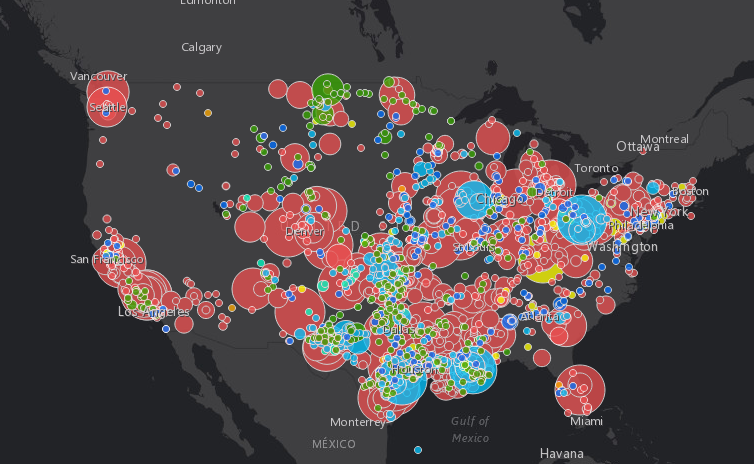
    SIZE of spill. Map for North America here.
    The size of the circle indicates the size of the spill. Note the big
    circles; size of the circle indicates the size of the spill. Blue is
    refined oil (gasoline, diesel, etc.). Red is NatGas. Since NatGas just
    vents into the atmosphere (unless it catches fire or is flared), it’s a
    “clean” spill. Kinda. Natural Gas is a wicked greenhouse gas, with a
    warming factor of 80x more than carbon dioxide. 

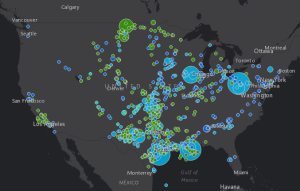
    The next chart just shows oil & gasoline spills. Crude oil in green (ironically), refined petroleum in blue. Zoom in and select a circle to find out more about the spill (year and amount).

    Yellowstone is in the northeast corner of Wyoming. Yellowstone has had two notable oil spills
    since 2010: an oil spill on the Exxon-Mobil pipeline in 2011, and
    another spill in 2015 from the pipeline owned by the True Companies.
    Those spills seem tiny compared to the thousands of spills throughout
    North America. No info from Canada though. There have been many oil
    spills in the Alaska pipelines that run all the way through Canada to
    the US.

    Note that there are tens of thousands of old wells that
    have been abandoned; many have never been capped or have been poorly
    capped. Old wells are leaking massive amounts of oil and natgas. The big
    oil companies sell off the depleted wells to small companies. Those
    companies milk the well for a while and then go out of business. 

    “According to the Government Accountability Office, the 2.1 million unplugged abandoned wells in the United States could cost as much as $300 billion.[2]from this Wikipedia article on Abandoned Wells in the United States.
    There are abandoned oil wells everywhere: in the gulf, in Pennsylvania,
    in Texas, in California.  And that is in the USA where there are better
    regulations than most countries. Read about the Biden effort to go out
    and cap them at the NRDC. There are lots of other sources, but you get the idea.

    When
    you think of the costs to the environment, the costs to clean up, and
    the costs to not cleanup, the costs are massively greater than what you
    pay at the gas meter or at the pump. And yet the world’s governments
    still subsidize fossil fuels at the rate of $1T per year. According to the IMF, explicit fossil fuel subsidies are about 1% of GDP, but implicit is 6% to 7% of GDP (about $6T USD).
  • Oil & Gas Spills in North America Since 2010

    Oil & Gas Spills in North America Since 2010

    This was posted over in SustainZine originally, but it does pertain to Innovation. The costs of the old systems of fossil fuels are far greater than the price we all pay at the pump. Plus they are crazy subsidized (one estimate is 1% of GDP directly and about 6% indirectly).

    But here’s the article. *** SustainZine ***

    A question I sometimes ask of people who think that fossil fuels are here forever more and that electrification of everything will never happen… 

    Has there ever been an oil spill in Yellowstone National Park? If so, how many?

    The answer I get is surprisingly often, none. It is, after all, a National Park, right?

    ArcGIS does a map overlay with the data of your choice. In this case the data is documented oil and gas spills since 2010, by type of spill and the SIZE of spill. Map for North America here. The size of the circle indicates the size of the spill. Note the big circles; size of the circle indicates the size of the spill. Blue is refined oil (gasoline, diesel, etc.). Red is NatGas. Since NatGas just vents into the atmosphere (unless it catches fire or is flared), it’s a “clean” spill. Kinda. Natural Gas is a wicked greenhouse gas, with a warming factor of 80x more than carbon dioxide. 

    The next chart just shows oil & gasoline spills. Crude oil in green (ironically), refined petroleum in blue.

    Yellowstone is in the northeast corner of Wyoming. Yellowstone has had two notable oil spills since 2010: an oil spill on the Exxon-Mobil pipeline in 2011, and another spill in 2015 from the pipeline owned by the True Companies. Those spills seem tiny compared to the thousands of spills throughout North America. No info from Canada though. There have been many oil spills in the Alaska pipelines that run all the way through Canada to the US.

    Note that there are tens of thousands of old wells that have been abandoned; many have never been capped or have been poorly capped. Old wells are leaking massive amounts of oil and natgas. The big oil companies sell off the depleted wells to small companies. Those companies milk the well for a while and then go out of business. 

    “According to the Government Accountability Office, the 2.1 million unplugged abandoned wells in the United States could cost as much as $300 billion.[2]from this Wikipedia article on Abandoned Wells in the United States. There are abandoned oil wells everywhere: in the gulf, in Pennsylvania, in Texas, in California.  And that is in the USA where there are better regulations than most countries. Read about the Biden effort to go out and cap them at the NRDC. There are lots of other sources, but you get the idea.

    When you think of the costs to the environment, the costs to clean up, and the costs to not cleanup, the costs are massively greater than what you pay at the gas meter or at the pump. And yet the world’s governments still subsidize fossil fuels at the rate of $1T per year. According to the IMF, explicit fossil fuel subsidies are about 1% of GDP, but implicit is 6% to 7% of GDP (about $6T USD).
  • Oh Frack… Ain't no such thang clean oil n gas!

    You’ve heard that there ain’t no such thing as “Clean” Coal. Maybe scrubbing some of the sulpher and removing some of the heavly metals. But certainly not clean. And then there’s the dirty little secret of Coal Ash!.
    But this article sums up the current research related to fracking. Ouch. Evidense keeps mounting about the down-side of oil fracking. This article really sums it up. 
    Link to the Ecologist article on Fracking.
    Of course, our argument here at SustainZine, is focused around the sustainability nature of fossil fuels in general. It’s okay, kinda, to use fossil fuels, but only do so when you have a long term plan that is sustainable, and this is the bridge to the future.
  • BIG BP payout settlement of $18.7

    BP to Pay $18.7 Billion to Settle Deepwater Horizon Spill Claims http://www.wsj.com/articles/bp-agrees-to-pay-18-7-billion-to-settle-deepwater-horizon-oil-spill-claims-1435842739
    Put a huge amount of the BP litigation behind it.
    This would be the same as all the profits that the company has made since 2012. However the payment schedule is 1.1 million dollars per year.
    Yes, BP was pretty irresponsible back then. But it still makes one wonder what if it were not such a big company that can afford to make all of the payments and restitution? If this has been done by a small company, or a non-multinational company, then the whole cost of the oil spill would have gone to governments and individuals.
    So, feel free to hate BP, but it could have been a lot worse on the pain and recovery side.

  • As BP oil spill trial resumes, lying accusations bubble up – CBS News

    As BP oil spill trial resumes, lying accusations bubble up – CBS News:

    Everyone remembers the  massive Gulf oil spill starting April 20, 2010 and 87 days of spillage.

    As we all watched the pictures from the surface oil slick and the underwater cameras at the well head, it was a tale of two oil spills.

    BP: trickle … => Media: deluge
    BP: gallons … => Media: barrels

    BP: creek  => river

    But the truth is, no one anywhere believed the BP numbers.

    They really had no recovery plan. As this article said, they only had a plan to create a plan, if and when they needed a plan.

    Disaster recovery plans for businesses have details that have been well thought through. One page for a wellhead breach under water is not exactly a detailed plan.

    The dispersant (Corexit) works at the surface with sunlight and such. However about 45% of the Corexit was used at the well head, resulting in oil that was stuck in limbo half way to the surface. At the surface it can be removed and/or treated.

    More importantly, apparently, for BP was that at the surface it can more accurately be MEASURED.

    The difference between the 4.2m Barrels by Justice department experts and the 2.45mb by BP is almost half. Of course the BP numbers wrong. Is it more than 4.2mb, probably. Less, probably not.

    Additionally, however, the $1,100 penalty max per barrel (~42 gal/brl) would be essentially 4 times that ($4,300/brl) if BP is found negligent.

    That’s the difference between $18B in fines and about $2.7B (BP’s low-ball estimates and the lower fine).

    There really is, however, lots of blame to go around. The regulatory agency that rubber-stamped everything oil and mining related has now be disbanded in disgrace. The “plans” were the same for all oil drillers. Everyone was doing the same types of drilling, although maybe not quite the lax monitoring/procedures.

    AND the government had a limit on the exposure for drillers in a very cozy relationship with the oil companies. It was a paltry amount… with the official rationale of promoting drilling (and oil independence). Of course, that limitation was immediately revoked.

    Can you imagine if BP were a smaller player that simply went bankrupt? The good thing about a BIG company with deep pockets (pun) is that you can make ’em pay, and then keep making them pay.

    In the end, the oil industry is a far safer place because of the Deepwater Horizon oil spill.

    Here are some lessons learned (and used).

    ‘via Blog