Blog

  • Oil & Gas Spills in North America Since 2010

    Oil & Gas Spills in North America Since 2010

    This was posted over in SustainZine originally, but it does pertain to Innovation. The costs of the old systems of fossil fuels are far greater than the price we all pay at the pump. Plus they are crazy subsidized (one estimate is 1% of GDP directly and about 6% indirectly).

    But here’s the article. *** SustainZine ***

    A question I sometimes ask of people who think that fossil fuels are here forever more and that electrification of everything will never happen… 

    Has there ever been an oil spill in Yellowstone National Park? If so, how many?

    The answer I get is surprisingly often, none. It is, after all, a National Park, right?

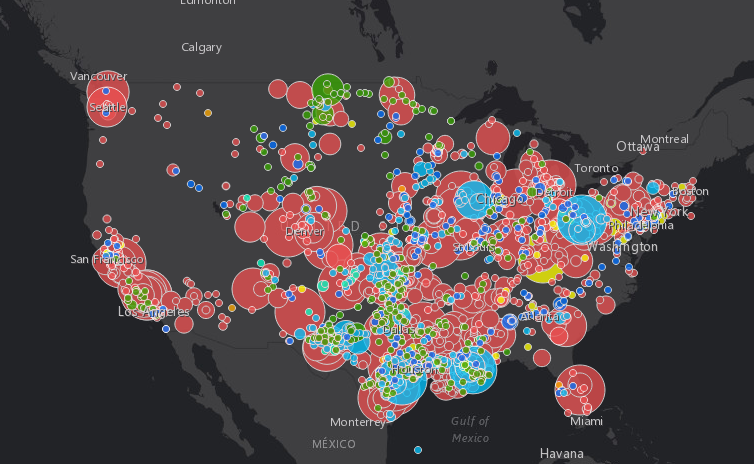
    ArcGIS does a map overlay with the data of your choice. In this case the data is documented oil and gas spills since 2010, by type of spill and the SIZE of spill. Map for North America here. The size of the circle indicates the size of the spill. Note the big circles; size of the circle indicates the size of the spill. Blue is refined oil (gasoline, diesel, etc.). Red is NatGas. Since NatGas just vents into the atmosphere (unless it catches fire or is flared), it’s a “clean” spill. Kinda. Natural Gas is a wicked greenhouse gas, with a warming factor of 80x more than carbon dioxide. 

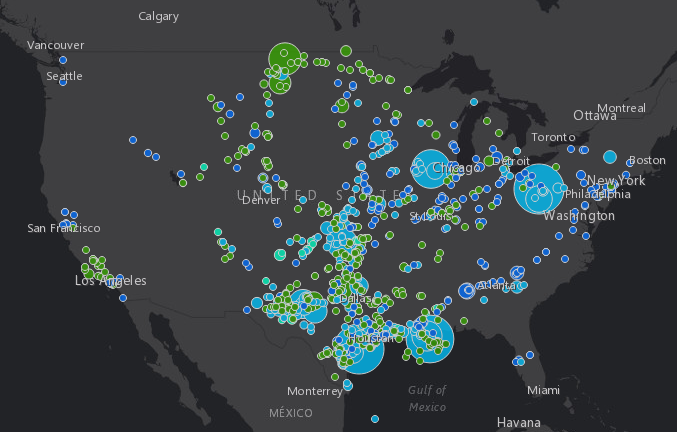
    The next chart just shows oil & gasoline spills. Crude oil in green (ironically), refined petroleum in blue.

    Yellowstone is in the northeast corner of Wyoming. Yellowstone has had two notable oil spills since 2010: an oil spill on the Exxon-Mobil pipeline in 2011, and another spill in 2015 from the pipeline owned by the True Companies. Those spills seem tiny compared to the thousands of spills throughout North America. No info from Canada though. There have been many oil spills in the Alaska pipelines that run all the way through Canada to the US.

    Note that there are tens of thousands of old wells that have been abandoned; many have never been capped or have been poorly capped. Old wells are leaking massive amounts of oil and natgas. The big oil companies sell off the depleted wells to small companies. Those companies milk the well for a while and then go out of business. 

    “According to the Government Accountability Office, the 2.1 million unplugged abandoned wells in the United States could cost as much as $300 billion.[2]from this Wikipedia article on Abandoned Wells in the United States. There are abandoned oil wells everywhere: in the gulf, in Pennsylvania, in Texas, in California.  And that is in the USA where there are better regulations than most countries. Read about the Biden effort to go out and cap them at the NRDC. There are lots of other sources, but you get the idea.

    When you think of the costs to the environment, the costs to clean up, and the costs to not cleanup, the costs are massively greater than what you pay at the gas meter or at the pump. And yet the world’s governments still subsidize fossil fuels at the rate of $1T per year. According to the IMF, explicit fossil fuel subsidies are about 1% of GDP, but implicit is 6% to 7% of GDP (about $6T USD).

  • Smile no more. Amazon.

    Smile no more. Amazon.

    For years credit cards, Amazon, eBay and others have had “affinity” programs where a charity could be designated to receive money associated with normal sales activities. In the case of Amazon, Amazon Smile program, 0.5% of qualifying sales goes to your favorite charity. “You shop. Amazon Gives.” The program has been very successful growing since inception in 2013 to more than a million charities and about $400m donated over the decade.

    (more…)
  • Scenario Planning within Nonprofits

    Scenario Planning within Nonprofits

    A seminar for nonprofits included discussion of scenario planning as it pertained to the Great CIVID Pandemic. It wasn’t so much scenario planning as we use it here on ScenarioPlans.com, as best, worst, and most-likely case (but more on that later). Imagine the nonprofit, out on thin ice, as the world’s economy went into lockdown. What if all funding froze up, even the promises of commitment? What if we are over-whelmed (under-whelmed) with customer needs? What if we have to cease operations (for an indefinite time)?

    An excellent article with tools is at Bridgespan: Nonprofit Scenario Planning During a Crisis. (Image is from Bridgespan.)

    (more…)
  • Scenario Planning for Nonprofits During Uncertain Times

    Scenario Planning for Nonprofits During Uncertain Times

    Our sister site www.ScenarioPlans.com talked about the importance of scenario planning for nonprofits: Scenario Planning with Nonprofits. Of course it is great to do scenario planning every few years so the plans (and contingency plans) are already developed, but most organizations don’t do formal scenario planning, at best, they do worst, best and most-likely case analysis once disaster has arrived.

    Look at the ScenarioPlans.com blog on Scenario Planning with Nonprofits.

    Useful tools at Bridgespan: Nonprofit Scenario Planning During a Crisis. (Image is from Bridgespan.) Just knowing what the worst case looks like enabled the executives to have a comfort level on how to move forward. Notice how Bridgespan a table with best case on the left. Maybe cut executive salaries by 15%. In the worst case, layoffs and cut executive salaries by 30%.

    Scenario Planning for Nonprofits should be more than worst, best and most-likely case. But no mater what you call the scenario planning tool, it is very helpful during times of uncertainty.

  • Innovative Countries — Global Innovation Index

    Innovative Countries — Global Innovation Index


    This is a great summary of innovation by country from Visual Capitalist. See the Global Innovation Index (GII) map here:https://www.visualcapitalist.com/most-innovative-countries-2022/

    We,
    at Strategic Business Planning Company, www.SBP.com, are always
    interesting in all aspects of innovation. Sometimes we hear from a
    layperson or an executive that the most innovative country in the work
    is …  

    Israel and Ireland were
    mentioned in recent years.  One executive said that “all innovation
    comes from Israel”. All right, admittedly, Israel is a great source of
    innovation and invention, but it is a very small country (population,
    GDP). In absolute terms, Israel is not even close, but in relative terms
    (adjusted for size of country), Israel is a very respectable #16 in the
    world (GII score of 50.2).

    So,
    a quick search came up with this great source at Visual Capitalist
    shows that the top 6 countries are: Switzerland, USA, Sweden, and the UK
    all with innovation scores above 60. The rest of the top 10 had
    innovation scores over 56.

    Rank

      Country / Region

    Score

    1

    Switzerland

    64.6

    2

    U.S.

    61.8

    3

    Sweden

    61.6

    4

    United Kingdom

    59.7

    5

    Netherlands

    58.0

    6

    South Korea

    57.8

    7

    Singapore

    57.3

    8

    Germany

    57.2

    9

    Finland

    56.9

    10

    Denmark

    55.9

    Here is the summary of how the Global Innovation Index is developed/designed. (quote)

    Innovation is inherently challenging
    to quantify, but the Global Innovation Index is a longstanding attempt to do
    just that. The framework used for the index was
    designed to create a more complete analysis, comprising of 81 indicators
    across seven categories to calculate a country’s score:

    7 Categories

    Example Indicators

    🧳 Business Sophistication

    Business R&D spend, net inflows of foreign direct
    investment

    📈 Market Sophistication

    Size of economy’s GDP, intensity of local market
    competition

    🛣️ Infrastructure

    Road, hospital, school construction, energy efficiency

    👩‍🏫 Human Capital & Research

    Government funding per pupil, quality of scientific and
    research institutions

    🏛️ Institutions

    Political stability and safety, ease of starting a
    business

    💡 Creative Outputs

    Most valuable brands, industrial design applications,
    trademark applications

    👨‍💻 Knowledge and Technology Outputs

    Patent applications,
    increase in labor productivity, spending on software

    As the above table shows, the
    framework aims to identify indicators that foster an innovative environment and
    breakthrough technologies.

    Other Countries

     The article talks about regions, like North America (namely, US and Canada) and the EU with some 15 very innovative countries. 

    China came in 11th
    (GII score of 55.3). China sucks up technology from around the world —
    legally, unethically, and illegally. And then China shamelessly deploys
    and commercializes technology. In terms of patents, China is by far the
    busiest patent office in the world. World Intellectual Property Organization shows
    that China continues to be the busiest patent office in the world. The
    patent protection in china is not because it is the 2nd largest economy
    in the world behind the USA, it is because patent protection in the
    other big economies is also protected by reducing the knock-offs and
    piracy from China (India and other countries).

    South
    Africa is generally low on the GII innovation index with South Africa
    rated 61st country (GII of 29), then Morocco and Tunisia. The nexus of
    innovation (regions or pockets of innovation) seems to explain much of
    the GII innovation.

    Summary

    Innovation
    is complex with may areas that enable economic growth and development. A
    well rounded environment for invention and innovation is best. There
    are several ways to get to an economic environment that is innovation
    enabled and invention friendly.